Econometrics Lecture 1
Topic: What is econometrics?
Many people have asked me:
econometrics – what exactly is it?
Especially after hearing that I study „computer science and econometrics” (yes, surprisingly, that’s a real major). The name is intriguing, true. But it turns out that the core of this whole econometrics field is quite interesting. You might even say it’s „practical”—finally something we study that can actually be used in real life 🙂
What do you need to begin your journey with econometrics?
A calculator for simple computations, basic knowledge about various functions, a bit of imagination, and the ability to connect facts. The rest will come naturally.
Let’s start with a short example.
Example 1
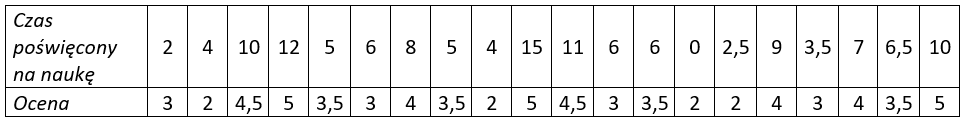
A group of randomly selected students was asked how much time they spent studying before an important test (in hours). Later, their grades were checked. The results were entered into a table:

Hmm… looking at raw numbers doesn’t say much to everyone. That’s why it’s helpful to plot a separate chart for each variable, i.e., for a given student, mark their grade and study time.
Here it is:
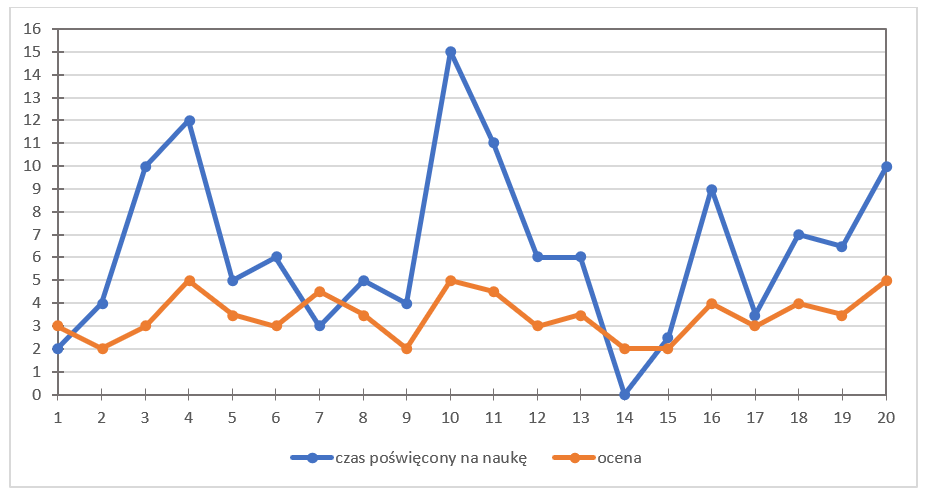
Where do these „waves” come from? The X-axis represents student number, and the Y-axis reflects the grade value (orange line) and the amount of study time (blue line). Matching point pairs is very important, so take a moment to examine the table and the dots.
I intentionally placed both graphs on one scheme. Why? To visually analyze how these variables behave—not relative to each student, but to each other. Maybe there’s a dependency or correlation between study time and test scores?
You can probably see that these graphs have recurring „peaks” and „valleys.” Do these highs and lows align? That is, do they occur for the same student simultaneously?
Of course, you’re right—clearly, they do. For example, here are some peaks: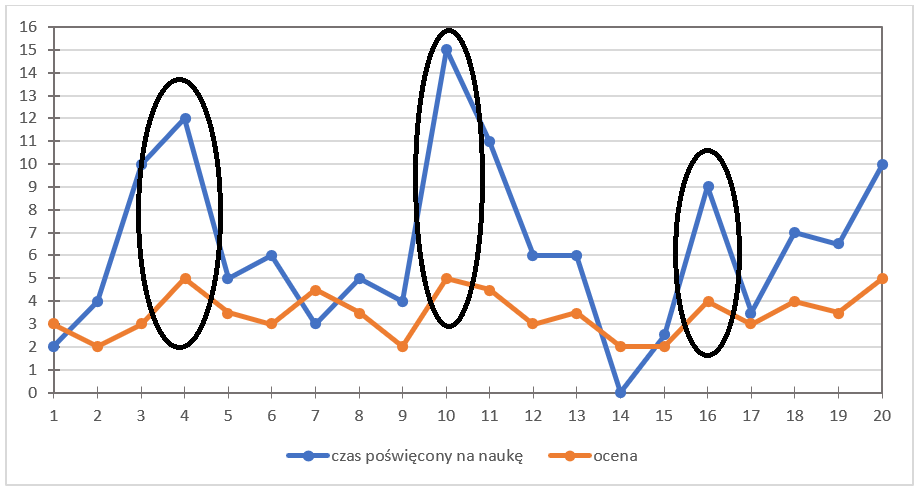
and here are valleys:
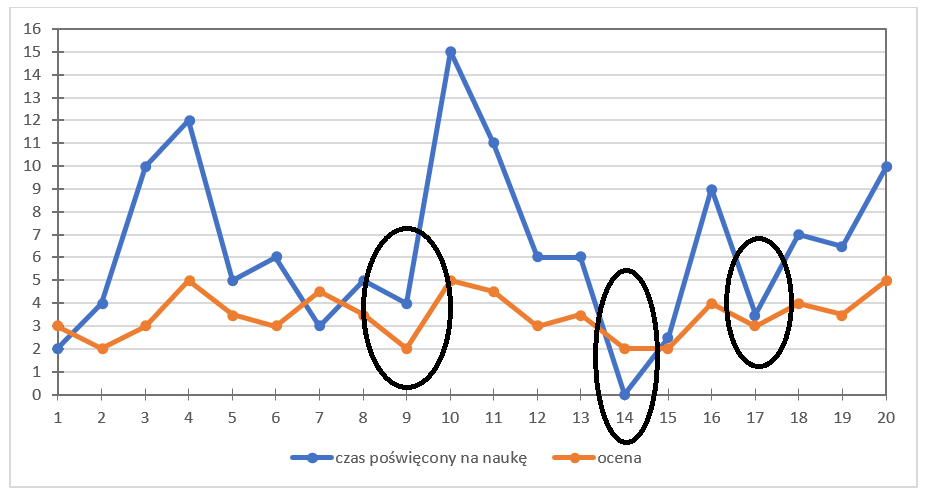
As you can see, analyzing data that reflects some concrete phenomenon (and yes, studying for a test can be a phenomenon 🙂 ), you can identify certain PATTERNS. What do you think?
Exactly—you can clearly see (especially based on the chart) that the longer you study, the better the grade (and vice versa). Usually, that’s true. Even very true. But keep in mind, there are always exceptions to the rule. (Reminds me of the saying: „Know enough for a 2, hope for a 3, get a 4, and wonder why not a 5 :)”)
Now that we’ve found a relationship between the two variables, let’s make another graph—this time plotting study time against the grade. Instead of using student numbers and individual variables, let’s just use these two:
Let’s say study time is variable X, and the grade is variable Y. Here’s what the points look like:
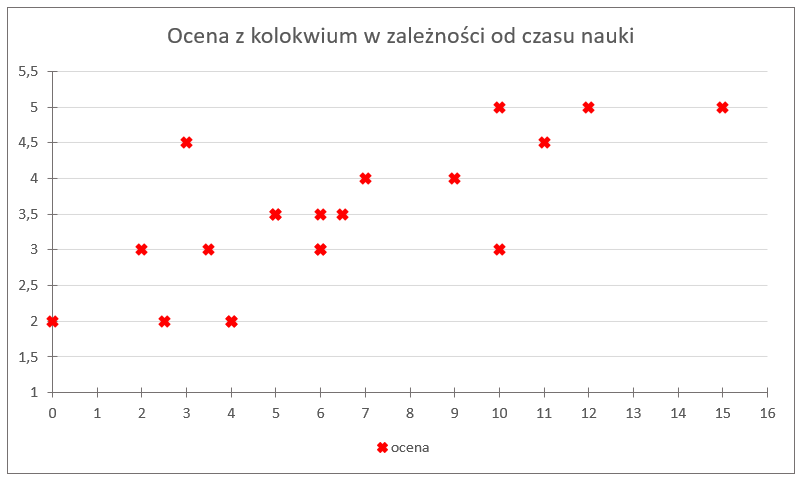
As you can see, it’s hard to connect all the dots with one broken line. You just can’t. But this „cloud” of points forms a characteristic shape, look:
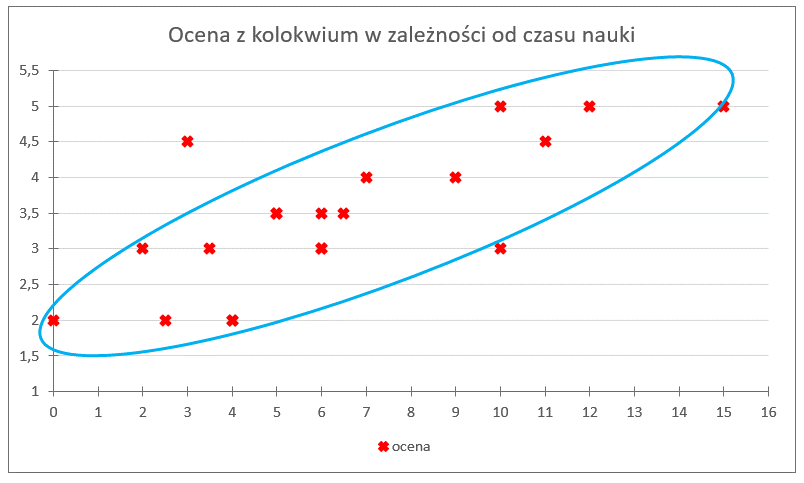
What do you think about the shape? The slope?
As you can see, it slopes upward. Our observed relationship (increased study time = better grade) is confirmed. As for the shape, you could even say it’s linear—close to a single upward line that “wraps around” the cloud of points.

It turns out that the observed regularity between the two variables can be expressed mathematically. Indeed!
Of course, we must remember that this is not an exact representation, just an approximate function that attempts to describe the relationship as best as possible. In this case, it’s similar to a straight line—a linear function.
Since we’ve established that most of the points can be described with a single function, we can say they can be MEASURED. So now we just need to determine how to construct this function, calculate it, and understand its practical use.
That’s where econometrics comes in!
THE END
Click here to learn what an econometric model is (next lecture) →
Click here to return to the econometrics lecture page