Econometrics Lecture 4
Topic: Data for the Model
You already know exactly what an econometric model is. A key role is played by variables — the dependent variable and the explanatory variables. However, before you start building anything, you need appropriate material. That material is statistical data. All necessary calculations will be performed on the basis of these data.
Collecting statistical data is a crucial step in econometric modeling.
Before I show you the ways of presenting collected data, let us start at the beginning — with the source. Here are a few suggestions on where you can obtain statistical data:
- publications of the Central Statistical Office of Poland (GUS), such as Yearbooks, Statistical Bulletins, Indicators, Reports, etc.;
- ready-made statistical databases (available on the GUS website), for example the Local Data Bank (BDL), the Macroeconomic Data Bank (BDM), Domain Knowledge Databases (DBW), the Geostatistical Portal, and many others;
- publications of the National Bank of Poland (NBP);
- stock market data;
- financial data of enterprises;
- surveys;
- others…
Which source you choose depends primarily on the type of variable you want to use in the model.
In the video below, I show how you can easily, quickly, and conveniently download data from the largest database of the Central Statistical Office — the BDL:
Forms of data presentation
Once you have downloaded the statistical data, you need to organize them properly. They can be presented in various forms. Here are the three most common ones:
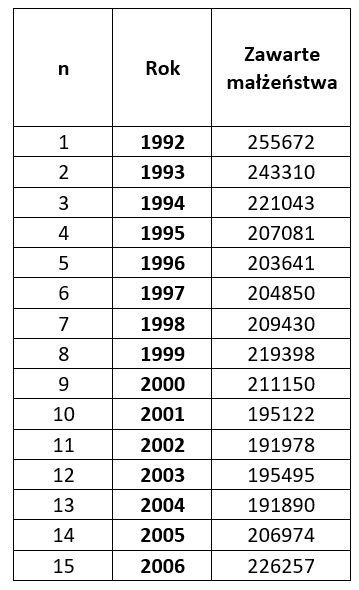
a) Time series data — numbers corresponding to the values assumed by a variable at successive, equally spaced points or intervals in time (e.g. years, quarters, months).
These are the most popular data sets. Examples include GDP, employment, inflation rate, population size, number of pharmacies, number of doctors, arable land area, etc. They are compiled as annual, quarterly, monthly, and even daily data (such as the value of investment fund units) or hourly data (exchange rates, returns on securities).
In a table, they can be presented for example as follows:
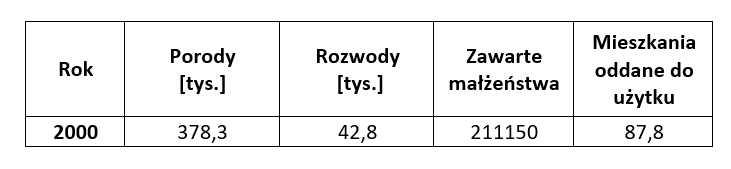
b) Cross-sectional data — data expressing the state of a phenomenon at a fixed point in time.
Cross-sectional data arise from observations made at the same time for many variables.
An example would be observations of household budgets. Periodically, the Central Statistical Office conducts surveys of several thousand randomly selected households. Thanks to these surveys, information is available on the incomes and expenditures of surveyed families, their demographic composition, housing conditions, and possession of durable goods, etc. These are very detailed data illustrating the diversity of the analyzed households.
Another example of related variables observed within a single year:
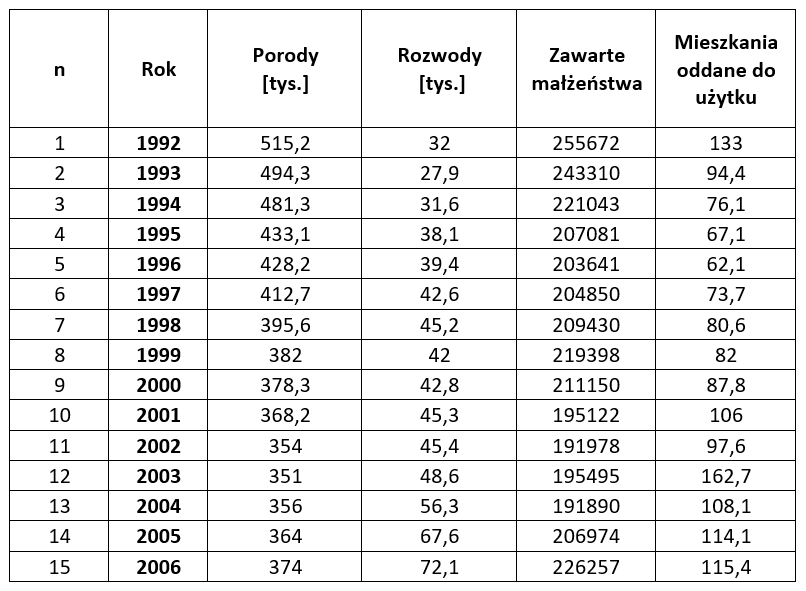
c) Panel data (combined, longitudinal) combine features of time series data and cross-sectional data. This means that you have several variables observed over a number of consecutive periods.
Example 1
Based on time series data, we can determine how the share of working women changes over time. Based on cross-sectional data, we should examine how this share depends on women’s age, education level, or the stage of the family life cycle. However, only panel data allow us to determine how the structure of employed women changes — for example, when women start, interrupt, and resume employment.
For example, the following is a set of other panel data:
In addition to numerical data collected from known statistical sources, you can also use “non-numerical” variables in the model. Examples include education, gender, marital status, well-being assessment, etc. You can read more about how to do this in my article:
Dummy variables, or how to express words with numbers
It should be remembered that not all statistical data you manage to find will be appropriate or correct. Their imperfections, arising from various causes, may sometimes have a decisive impact on the estimated model. We may look for the cause of poor model performance in its equation, while in reality the error lies in the collected statistical data. Or we may struggle to find appropriate variables for the model, unaware that the problem is poorly completed surveys.
END
Click to review why the random component is included in the model (previous Lecture) <–
Click to check how to measure the strength of relationships between variables (next Lecture) ->
Click to return to the Econometrics Lectures page